
In today’s competitive software market, the importance of delivering high-quality, user-friendly applications cannot be overstated. Beta testing plays a crucial role in the software development lifecycle, ensuring that the final product meets users’ expectations and functions seamlessly.
As app development experts, we recognize the significance of beta testing in delivering top-notch mobile apps—which is why we’ve created this comprehensive guide. In this post, we’ll explore the concept of beta testing, its importance in mobile app development, and best practices to help you get the most out of your beta testing process.
What is Beta Testing?
Beta testing is the second phase of software testing, following alpha testing, in which a limited group of end-users tests a nearly-complete version of the software or mobile app.
The primary goal of beta testing is to identify any remaining bugs, usability issues, or other problems that the development team may have missed during internal testing. By collecting feedback from real users, developers can gain valuable insights into how their product performs in a real-world environment and make any necessary improvements before the final release.
Alpha Testing vs. Beta Testing
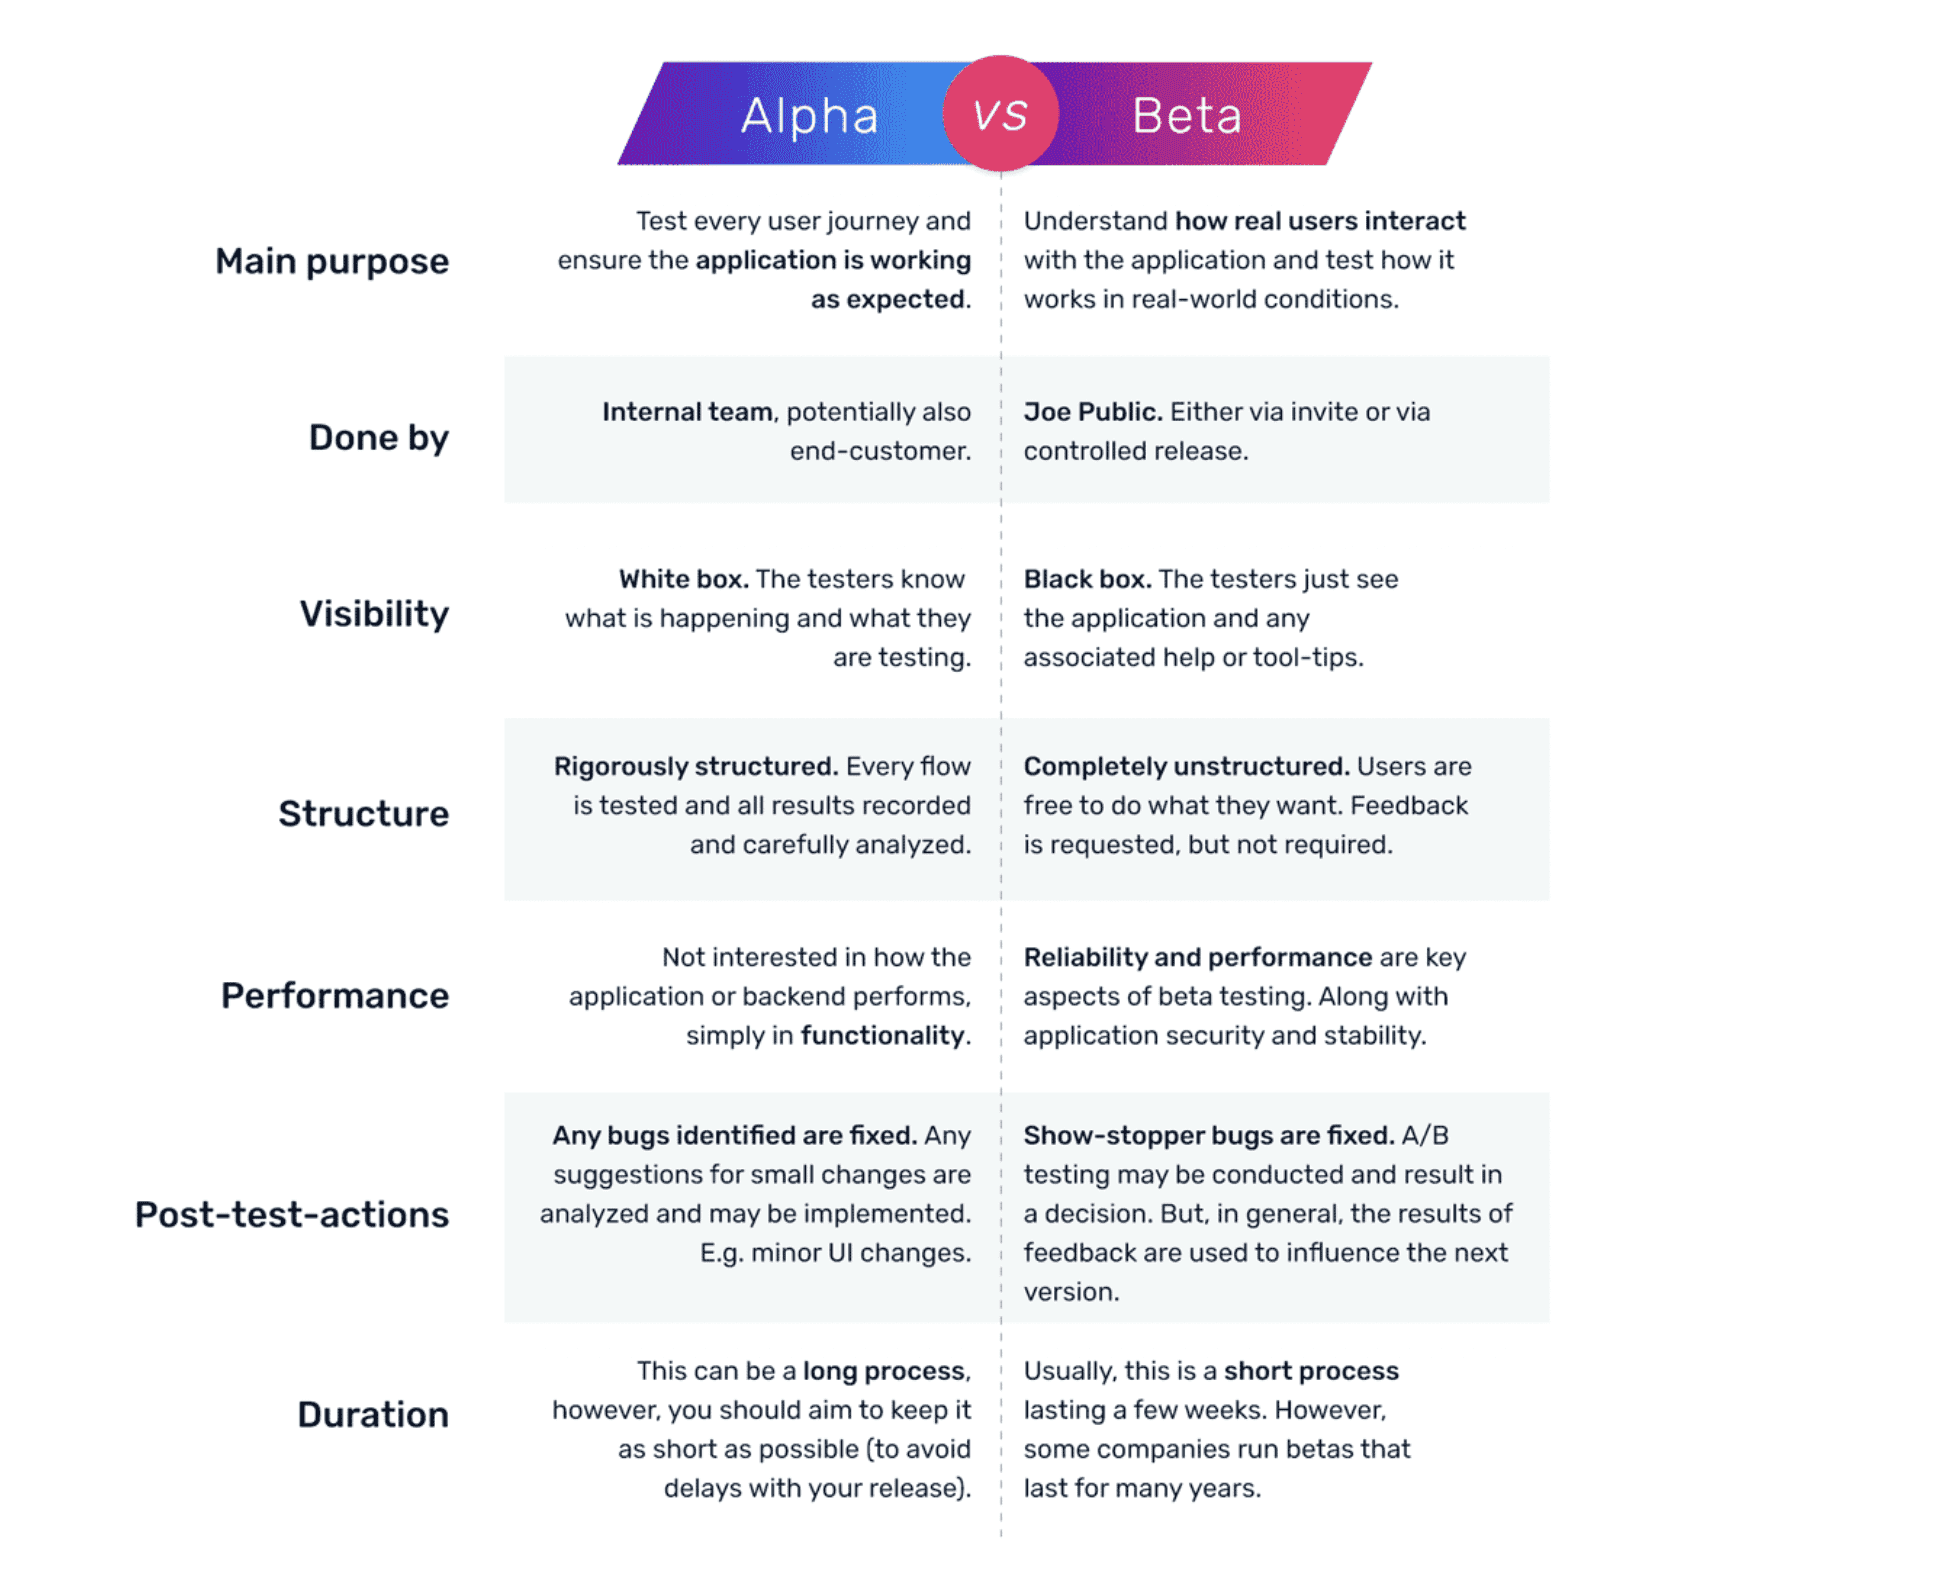
Alpha testing is the first phase of software testing—conducted internally by the development team and a select group of employees within the organization. This testing phase aims to identify and fix any critical bugs or issues before the software reaches the beta testing stage.
While alpha testing focuses on functionality and stability, beta testing emphasizes usability, compatibility, and overall user experience.
Here’s a more in-depth comparison of alpha testing vs. beta testing.
Importance of Beta Testing for Mobile App Development
Beta testing is particularly vital in mobile app development for several reasons:
- User Experience: Mobile apps need to be intuitive, responsive, and easy to use. Beta testing allows developers to collect feedback from actual users and make adjustments to ensure the app delivers an excellent user experience.
- Device Compatibility: With the plethora of devices, screen sizes, and operating systems, ensuring compatibility across all platforms is crucial. Beta testing helps developers identify and resolve any compatibility issues that may arise on different devices.
- App Store Rankings: Positive user reviews and high ratings are essential for a successful app launch, as they significantly impact app store rankings. By addressing any issues during beta testing, developers can increase the likelihood of receiving favorable reviews upon release.
The Beta Testing Process
The entire beta testing process can be broken down into six simple steps:
- Planning and Preparation
- Recruitment and Selection of Beta Testers
- Conducting the Beta Test
- Collecting and Analyzing Feedback
- Iterating and Refining the Product
- Preparing for Release
We’ll cover each of these in greater detail below.
Step 1 – Planning and Preparation
Before initiating the beta testing process, it’s essential to define clear objectives for your tests. These objectives may include identifying bugs, validating features, and assessing overall user satisfaction. Having well-defined goals will help guide the testing process and ensure that the final product meets your desired standards.
You also need to identify the target audience of your app or software. That’s because your beta testers should represent this target audience—as they’ll provide the most relevant feedback during your tests. Consider factors like demographics, technical expertise, and device usage when selecting your testers.
Make sure to provide your testers with all of the necessary resources, including the test build, user manuals, and any supporting documentation. Ensure that your materials are clear and concise to enable testers to use the app effectively.
Step 2 – Recruitment and Selection of Beta Testers
When choosing beta testers, consider their technical expertise, familiarity with similar apps, and availability. It’s essential to have a diverse group of testers, as this will help identify a wide range of issues and provide a more comprehensive understanding of the app’s performance.
To recruit a diverse group of testers, you can reach out to your existing user base, use social media platforms, or collaborate with online testing communities. Be sure to clearly communicate your testing objectives and expectations to potential testers, as this will help you attract individuals who are genuinely interested in providing valuable feedback.
Step 3 – Conducting the Beta Test
Share the beta version of your app and any necessary supporting materials with your selected testers. Depending on the platform and the type of beta test (closed or open), you may need to use specific distribution methods—such as app store beta testing programs or third-party distribution tools.
Clearly communicate the testing process, objectives, and expectations to your testers. Provide them with step-by-step instructions for installing the app, reporting issues, and submitting feedback. This will ensure that testers can effectively participate in the testing process and contribute valuable insights.
You should also set up a dedicated channel for testers to submit feedback and communicate with your team. This could be an online forum, a bug-tracking system, or an email address. Ensure that your team members are available to respond to testers’ questions and concerns in a timely manner.
Step 4 – Collecting and Analyzing Feedback
As feedback comes in, organize and categorize it based on factors such as severity, frequency, and impact on the user experience. This will help you prioritize which issues to address first and allocate resources effectively.
Then you can analyze the collected feedback to identify any patterns or trends.
For example, if multiple testers report similar issues or suggestions, these may indicate areas where the app needs improvement. By recognizing these patterns, you can make more informed decisions about which changes to implement.
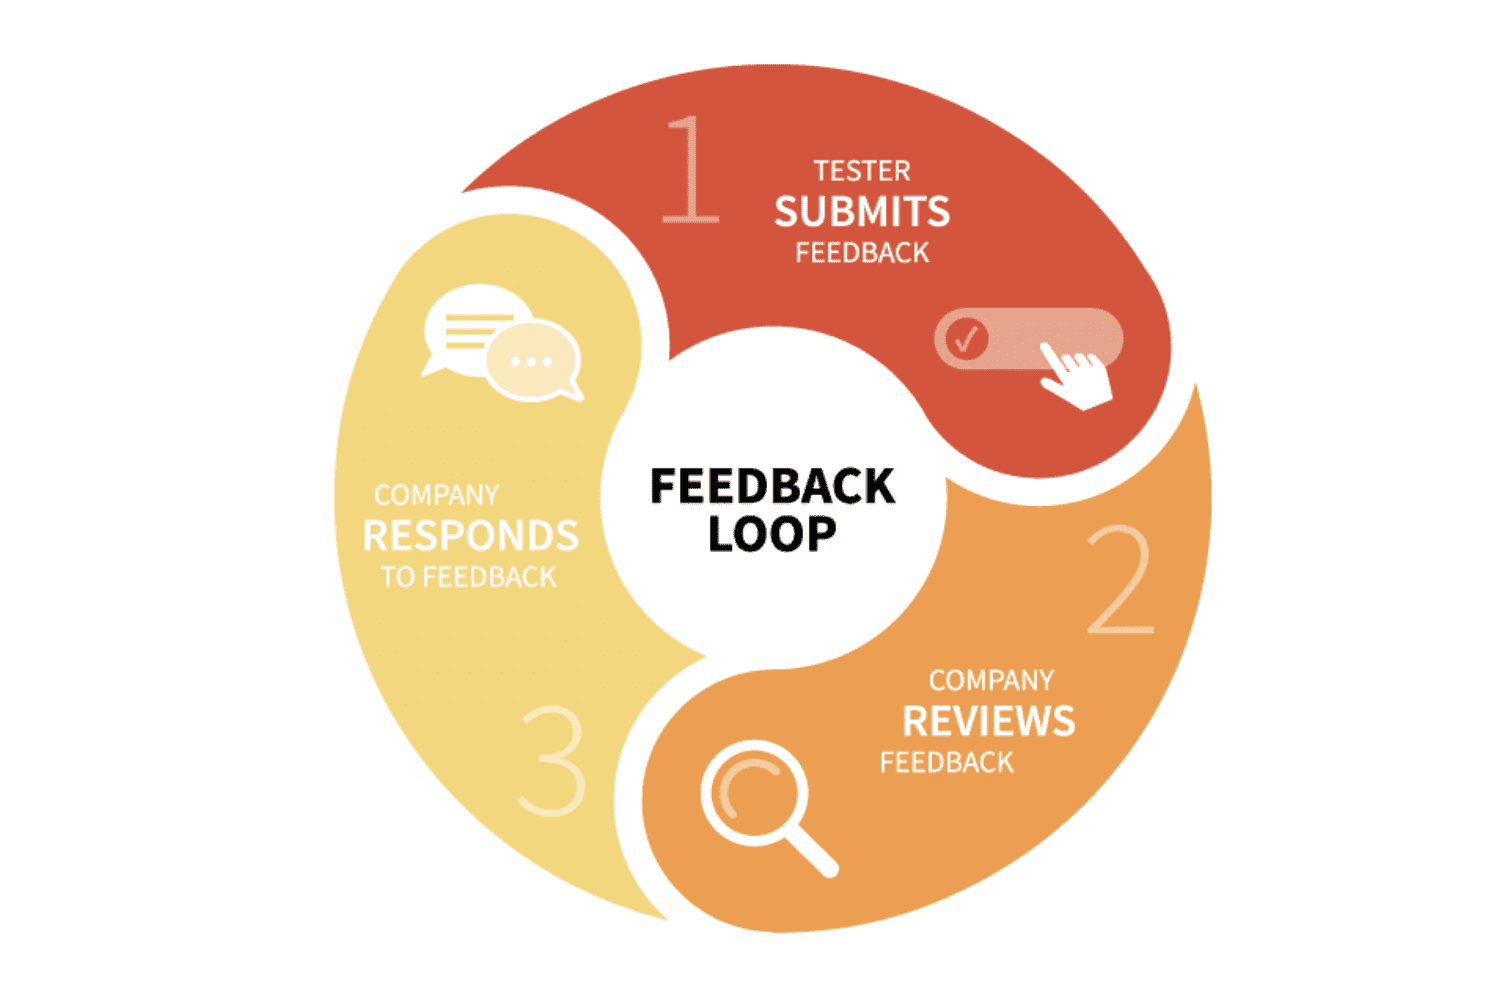
The initial feedback collected in your beta tests will help set up your feedback loop for iterations and future testing.
Step 5 – Iterating and Refining the Product
Based on the feedback analysis, make the necessary changes to your app. This may involve fixing bugs, enhancing features, or making adjustments to the user interface. Ensure that your team is aligned on the changes and that they are implemented effectively.
Once changes have been made, conduct further testing to validate that the issues have been resolved and that the app’s performance has improved. Depending on the scope of the changes, you may choose to involve the same group of testers or recruit a new group for a fresh perspective.
Step 6 – Preparing for Release
Now you can finalize your documentation and other software resources.
Update your user manuals, help guides, and other documents to reflect any changes made during the beta testing process. This helps ensure that users have access to accurate information upon the app’s release.
It’s also in your best interest to keep all stakeholders, including your team members, testers, and investors, informed about the app’s progress and the planned release date. This will help maintain engagement and support throughout the development process.
Types of Beta Testing
Generally speaking, there are two main types of beta testing—closed and open.
To determine which type of beta testing is best suited for your mobile app, consider factors like your testing objectives, target audience, available resources, and desired level of control over the testing process.
Some developers opt for a hybrid approach, starting with a closed beta test and then transitioning to an open beta test to capitalize on the benefits of both methods.
Closed Beta Testing
Closed beta testing is a private testing phase where a select group of users is invited to test the app. Access to the app is restricted, and testers may be required to sign non-disclosure agreements (NDAs) to maintain confidentiality.
This method allows for more controlled testing conditions—enabling developers to receive targeted feedback from a specific group of users. Closed beta testing can lead to a more focused and efficient testing process. However, the limited number of testers can result in less diverse feedback and may not uncover all potential issues.
Open Beta Testing
Open beta testing, also known as public beta testing, involves opening the app to a larger audience—often without any restrictions or invitations.
Users can voluntarily participate in testing, providing a wider range of feedback and helping to identify issues that might have been missed during closed beta testing.
Here’s an example of an open beta test from Google:
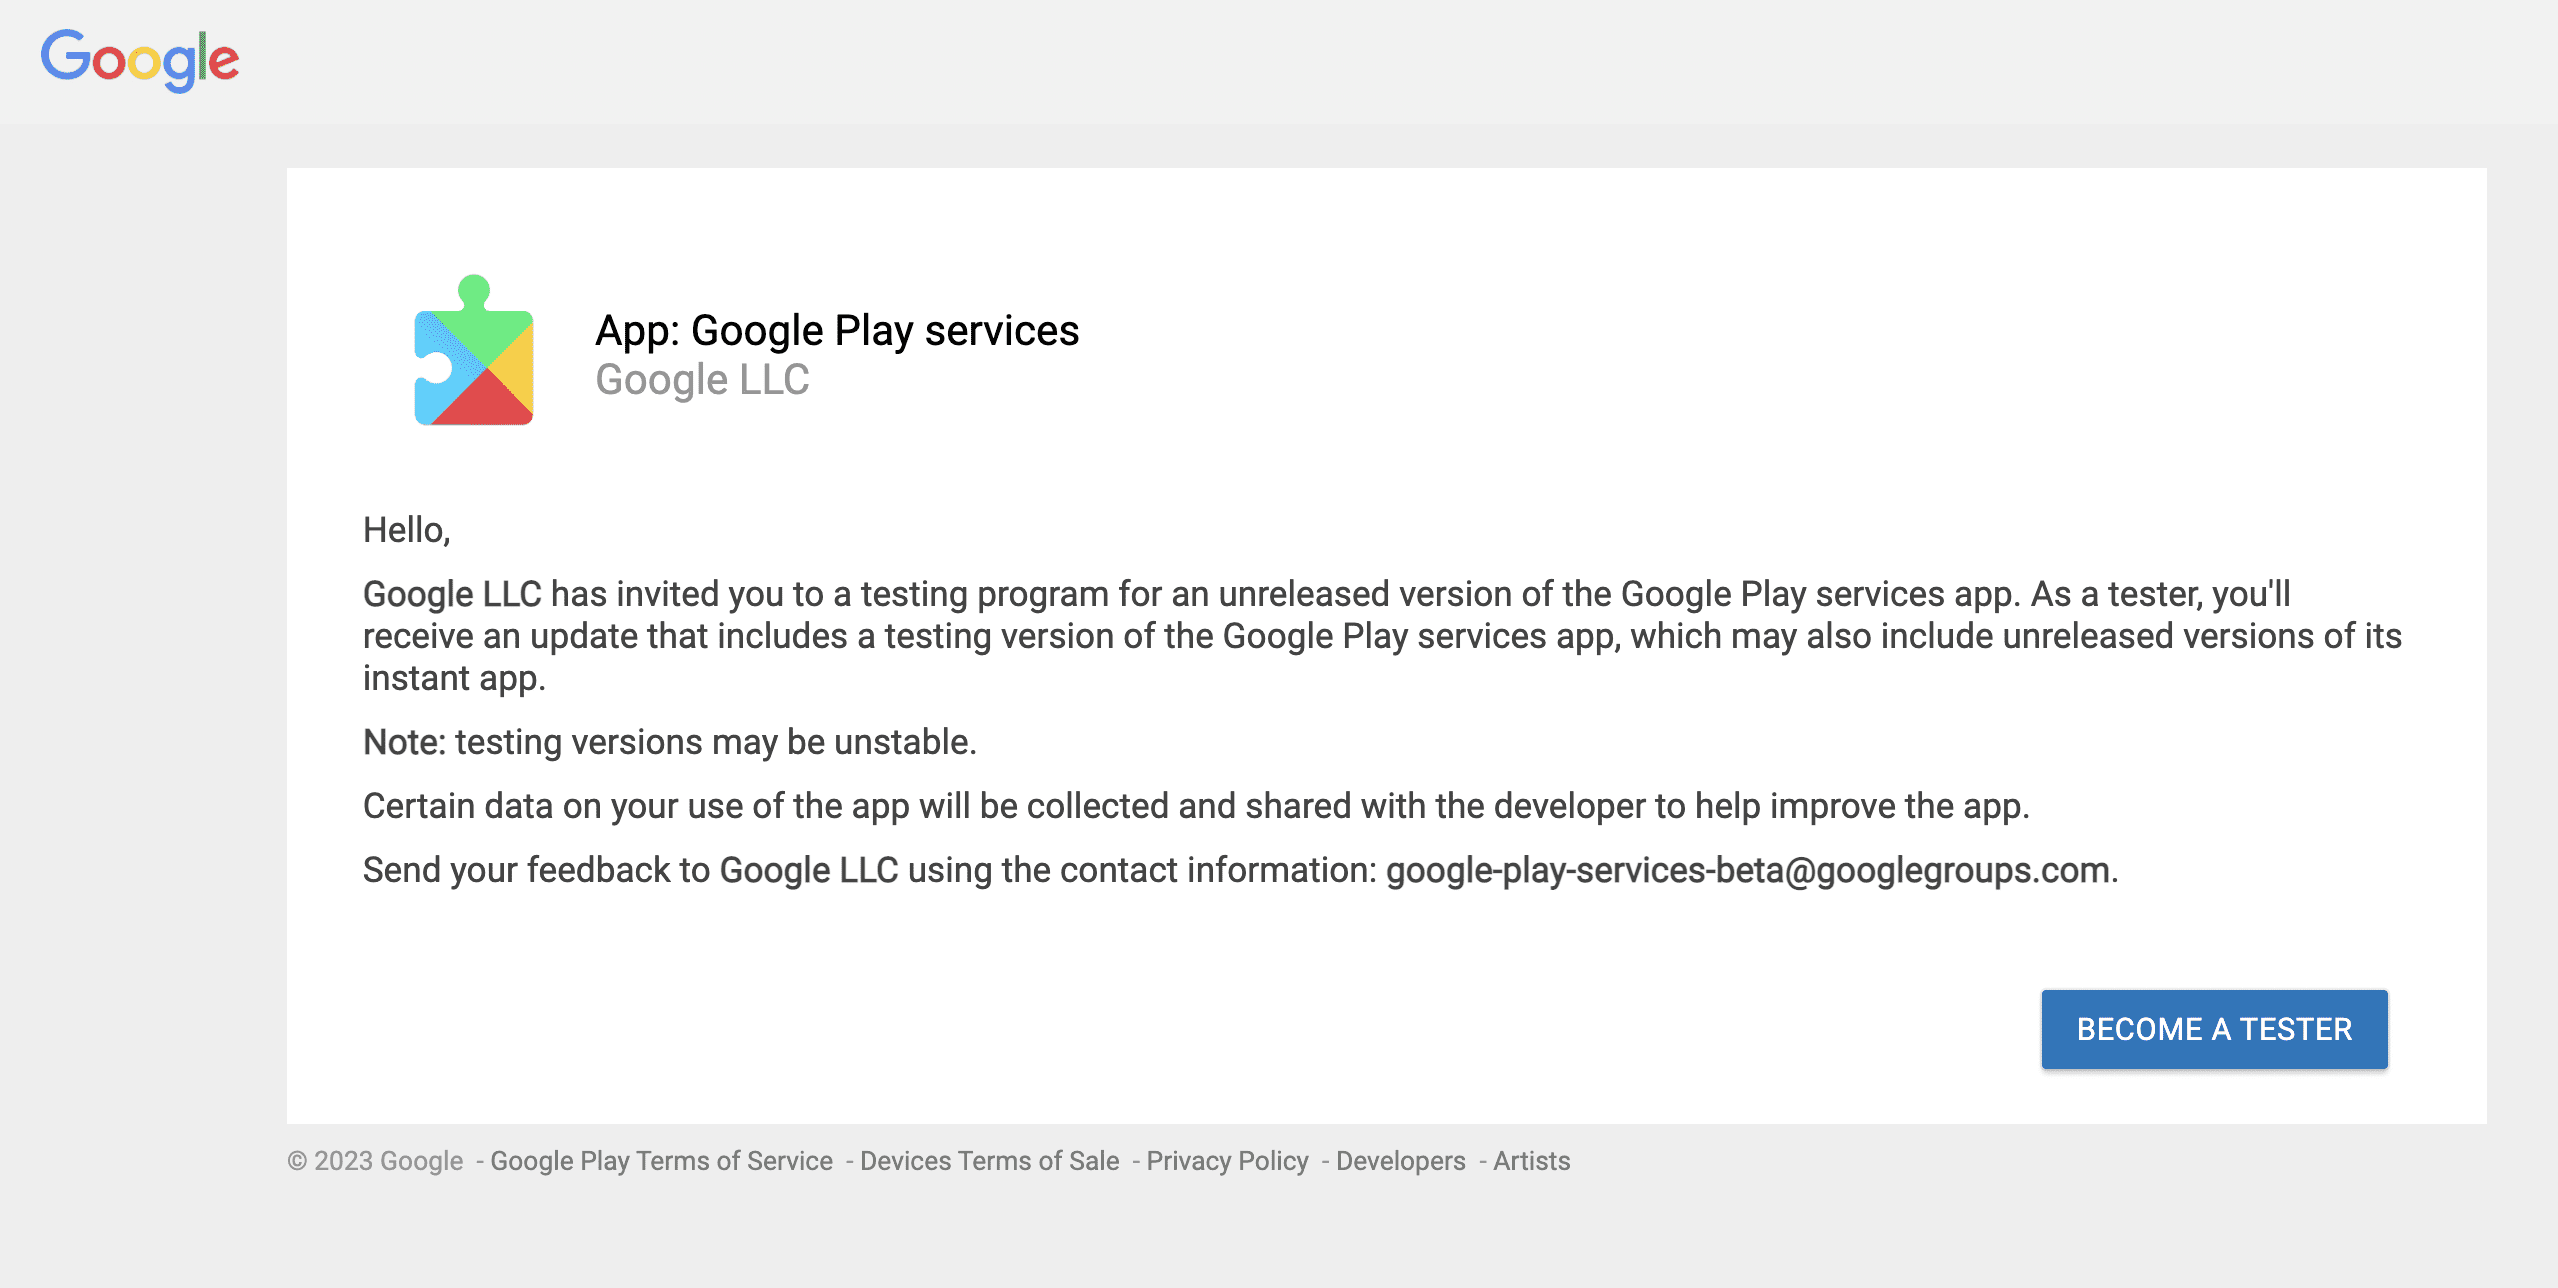
Open beta testing provides a larger pool of testers, increasing the likelihood of identifying a wide range of issues and gathering diverse feedback. This type of testing can also generate buzz and create a sense of community around the app before its official release. However, managing the feedback from a large number of testers can be challenging, and there is a risk of receiving low-quality or irrelevant feedback.
Beta Testing Challenges and Solutions
To ensure your tests run smoothly, it’s important to understand some common roadblocks and hurdles that often result in inaccurate or ineffective tests. First, we’ll identify those challenges and then give you some key tips for preventing and overcoming them.
Common Challenges Faced During Beta Testing
These are the three areas where software teams tend to struggle the most when they’re running beta tests:
- Time Constraints: Limited time for testing can lead to rushed processes and insufficient feedback. Balancing the need for thorough testing with the desire to release the app quickly can be challenging.
- Limited Resources: With finite resources, developers must prioritize which issues to address and which features to test more extensively. This can lead to difficult decision-making and potential trade-offs.
- Managing Tester Expectations: Testers may have different levels of experience and expectations, making it challenging to ensure a consistent and productive testing process.
Solutions to Overcome Challenges
These simple yet highly effective solutions will make it easier for you to run successful beta tests:
- Efficient Test Management: Establish clear objectives, expectations, and guidelines to streamline the testing process. Utilize tools and strategies to prioritize issues and allocate resources effectively.
- Leveraging Tools and Automation: Use testing tools and automation to increase efficiency and minimize manual tasks, freeing up time and resources for other critical aspects of the development process.
- Establishing Clear Communication: Maintain open lines of communication with your testers to address any questions or concerns, and provide regular updates on the app’s progress. This will help manage expectations and ensure a smoother testing process.
How to Measure the Success of Beta Testing
Running the test is just one aspect of beta testing. You also need to understand what you should be looking for in the tests to see if things were done properly or if you need to go through another round of testing.
The following KPIs are a good indication of whether or not your test was successful:
- Bug Discovery Rate: Track the number and severity of bugs identified during testing. A lower bug discovery rate may indicate a more stable and well-developed app.
- User Engagement: Monitor user engagement metrics such as session length, frequency of use, and feature adoption. High engagement levels can signify a positive user experience.
- Feedback Quality and Quantity: Assess the quality and quantity of feedback received from testers. Valuable and actionable feedback can help drive meaningful improvements to your app.
Then you can analyze the collected KPIs and other data points to make informed decisions about the app’s readiness for release and any necessary adjustments.
Be prepared to iterate on your product based on the insights gained during the beta testing process. Keep in mind that achieving success in beta testing is not about attaining perfection but rather about identifying and addressing the most critical issues and improving the overall user experience.
Leveraging Beta Testing Feedback for Future Development
Software testing is an ongoing process. So rather than looking at each test in isolation, you should also take steps to improve your testing and development process as a whole.
Learn from Feedback
Take the time to thoroughly review and understand the feedback received from your testers. This feedback can provide valuable insights into potential improvements, feature requests, and areas of user dissatisfaction. Use this information to prioritize future development efforts and create a roadmap for ongoing enhancements.
Maintain Relationships with Testers
Your beta testers can be a valuable resource even after the testing phase has concluded. Keep the lines of communication open and maintain relationships with your most engaged and helpful testers. They can provide ongoing feedback, help generate buzz for your app, and even become early adopters or advocates for your product.
Continue to Improve and Iterate
Remember that the development process doesn’t end with the release of your app. Continually refine and iterate on your product based on user feedback, analytics, and market trends. This will help you stay competitive and ensure that your app remains relevant and appealing to users.
Final Thoughts
Beta testing is a critical component of the mobile app development process, providing valuable insights into your app’s performance and user experience. By carefully planning and executing the beta testing process, you can identify and address potential issues, validate features, and ultimately deliver a high-quality app that meets the needs of your target audience.
We hope this ultimate guide to beta testing has provided you with the knowledge and tools necessary to effectively implement beta testing in your development process.